 3D Visualization of the Lower Quinnipiac River
Redevelopment Corridor
by
Natalia Hoyos and Ned Kalapasev
3D Visualization of the Lower Quinnipiac River
by
Natalia Hoyos and Ned Kalapasev
Introduction
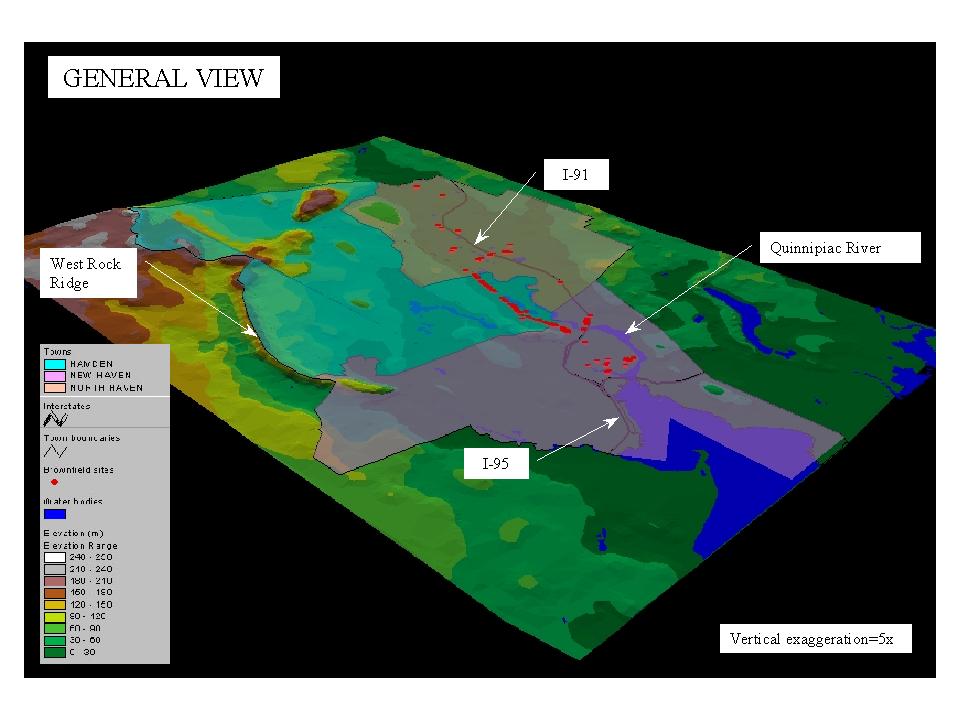
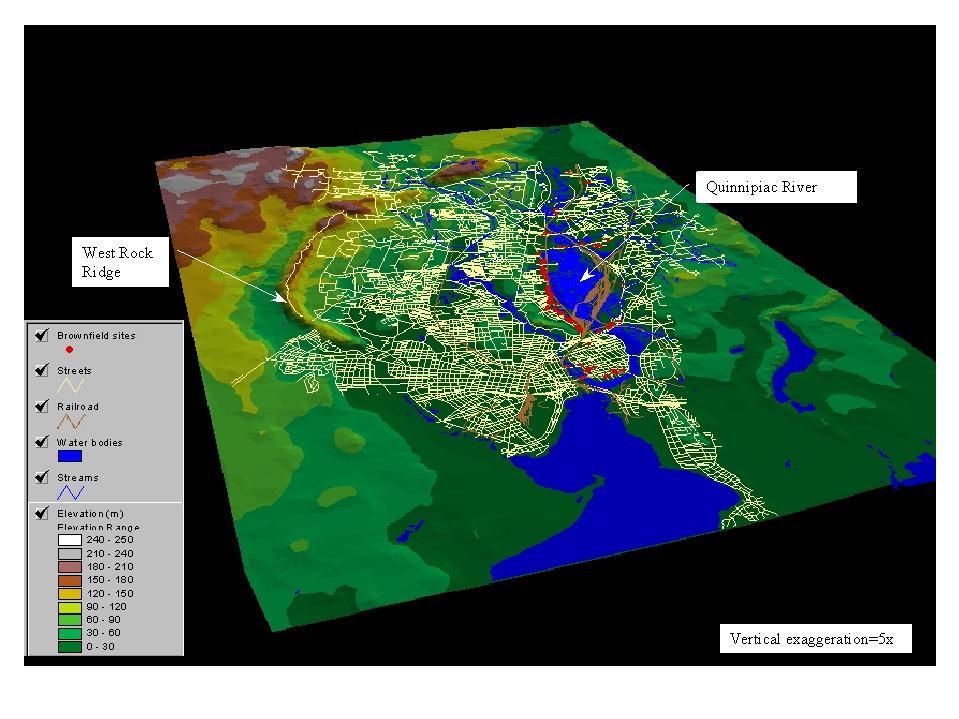
Some observations that can be drawn from the general views (Figures 1 & 2 ) are:
Some problems that we found when working with the 3D ArcView extension were related with the computer capability of dealing with large amounts of calculations and data. In addition, the extension doesn’t still allow the user to modify the graphical user interface (GUI). For this reason, it was not possible to create hotlinks and dialogs within the 3D views.
Conclusion
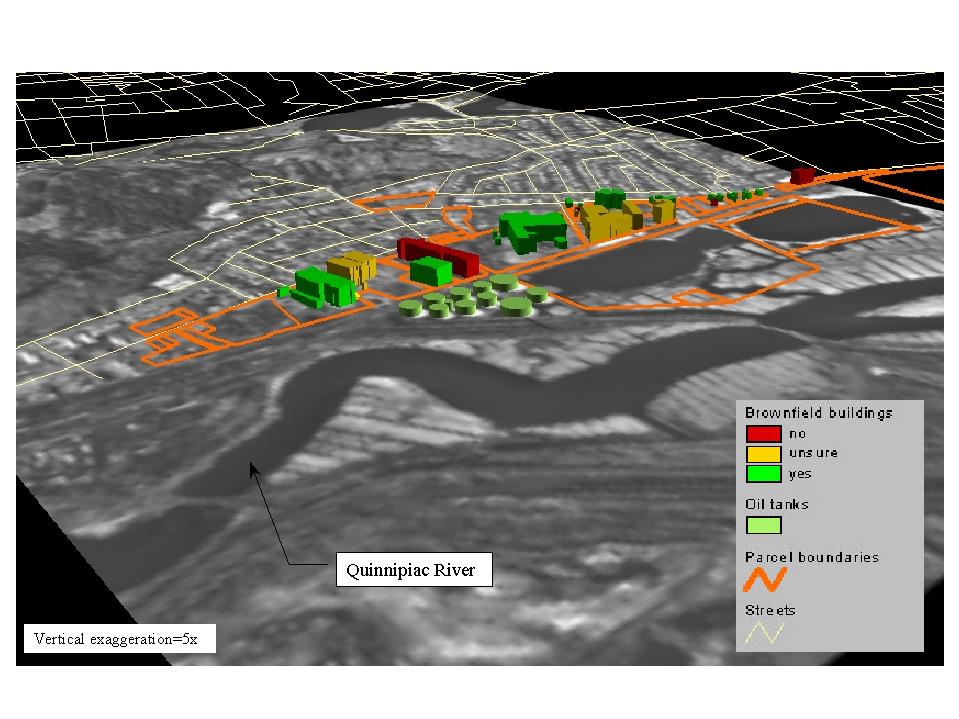
We found that 3D visualization, as a way of displaying data, is useful in providing information on general aspects and spatial relation of landforms, hydrology, populated areas, infrastructure and for this case, brownfield sites. Its major advantage, is that it makes it easier to visualize how objects are related to one another in space, and it allows the enhancement of certain characteristics by either exaggeration (vertical exaggeration of relief, contaminant concentration) or extrusion (buildings). The hypothetical scenario is just one example on how this tool can be used to display other relevant information, as it is produced. We believe that this will be very useful in future stages of the project. Finally, we consider that improvements in hardware and software are still needed to fully take advantage of the capabilities of the 3D analyst.
Relevant Links and References
Bell, M., Dean, C. and Blake, M. 1998. Forecasting the pattern of suburban
growth: decision-support in a GIS framework. Ninth Biennial Conference
of the
Australia Population Association. University of
Queensland, Brisbane. Web
Site
EPA 1998. Brownfields showcase community, Stamford CT. Fact sheet EPA
500-f-98-266.
Fisher, T.R. 1993. Use of 3D Geographic Information Systems in Hazardous
Waste Site Investigations. Pages 238-247 in Goodchild, M.F., Parks, B.O.
&
Steyaert, L.T. (eds). Environmental Modeling with
GIS. Oxford University Press, New York, New York.
McLaren, R.A. and Kennie, T.J. 1989. Visualization of digital terrain
models: techniques and applications. Pages 79-98 in Raper, J (ed). GIS
Three dimensional
applications in Geographic Information Systems.
Taylor & Francis, Bristol, Pennsylvania.
Swanson, J. 1999. The three dimensional visualization and analysis
of Geographic Data. Web
Site
Quinnipiac River Watershed and Region Web Site Department of Biology and Environmental Science at the University of New Haven